
Monitoring & Logging in Kubernetes


Monitoring cluster components of Kubernetes (K8s)

There are various type of monitoring we can perform at the cluster, node level and pod level. At cluster level we can monitor like number nodes running, how many are healthy, performance status, network usage etc.


 At the POD level we can monitor disk and cpu, memory utilisation, Performance metrics of each POD about its resources.

To utilise the experience of monitoring on kubernetes cluster we can use “Metrics server” 

We can have 1 metrics server per cluster. It's retrieves the information about Nodes , PODS aggregate them and store them into memory. 

Matrics server is IN-MEMORY solution where the data or information which it fatch from nodes and pod will be in memory and does not store it in disk. 


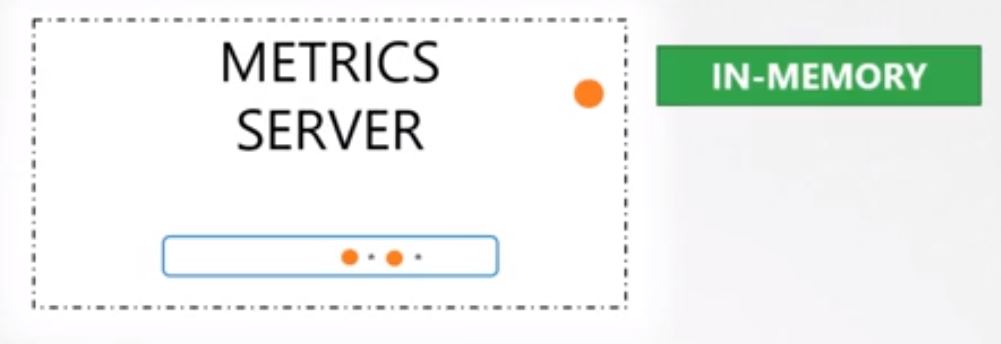
As Metrics server is "IN-MEMORY" where it's not possible to retrieve the historical data about the kubernetes resources. To get the historical data its require to use advance tool or proprietors monitoring tool supporting kubernetes

So how does the Metrics Server get data?? 

As you know each nodes having an agent called KUBLET which is responsible to get information from API server for running and assigning pods.


KUBELET is also running sub component which called cAdvisor or container advisor.

cAdvisor is responsible for exposing performance metrics from POD and exposing it to API server then it get the data available to Metrics server.

For enabling feature use below:

For minikube : Use below code to enable metrics-server.
>minikube addons enable metrics-server


For all other environment Clone the metrics server from GitHub repository.
>git clone https://github.comkubernetes-incubator/metrics-server.git

  • Kubectl create -f deploy/1.8+/ ( run this command after cloning. It may take time to install and configure MATRICS server so be patience.

  • Kubectl top nodes ( to view the metrics about nodes)

  • Kubectl top pod ( to view the metrics about PODS)

Application logging

For watching logs of containers into the POD we can use command “kubectl log -f (pod name) . This will give you the list of events  which fetch all the containers events.

What if we want to fetch event of specific containers in a pod. For gaining this objective we need to add one parameter into the pod definition file under spec section.


  • Name : image-processor
    image: some-image-processor
 Now to get the logs for the container using below command


Kubectl log -f (pod name) (container name)


Happy learning..... :)


Comments

Popular posts from this blog

Changing the FQDN of the vCenter appliance (VCSA)

This article states how to change the system name or the FQDN of the vCenter appliance 6.x You may not find any way to change the FQDN from the vCenter GUI either from VAMI page of from webclient as the option to change the hostname always be greyed out. Now the option left is from the command line of VCSA appliance. Below steps will make it possible to change the FQDN of the VCSA from the command line. Access the VCSA from console or from Putty session. Login with root permission Use above command in the command prompt of VCSA : /opt/vmware/share/vami/vami_config_net Opt for option 3 (Hostname) Change the hostname to new name Reboot the VCSA appliance.   After reboot you will be successfully manage to change the FQDN of the VCSA . Note: Above step is unsupported by VMware and may impact your SSL certificate and face problem while logging to vSphere Web Client. If you are using self-signed certificate, you can regenerate the certificate with the

Collecting Logs from NSX-T Edge nodes using CLI

  This article explains how to extract the logs from NSX-T Edge nodes from CLI. Let's view the steps involved: 1) Login to NSX-T  Edge node using CLI from admin credentials. 2) Use of  " get support-bundle " for Log extraction. get support-bundle command will extract the complete logs from NSX-T manager/Edge nodes. nsx-manager-1> get support-bundle file support-bundle.tgz 3) Last step is to us e of " copy file support-bundle.tgz url " command. copy file will forward your collected logs from the NSX-T manager to the destination(URL) host from where you can download the logs. copy file support.bundle.tgz url scp://root@192.168.11.15/tmp Here, the URL specified is the ESXi host ( 192.168.11.15) under /tmp partition where logs will be copied and from there one can extract it for further log review. Happy Learning.  :)

Removing NSX-T manager extension from vCenter

In NSX-T starting from ver 2.4 NSX-T appliance got decoupled from vCenter where now its not mandatory to run NSX-T on vCenter platform only. Now NSX-T can be managed through standalone ESXi host, KVM or through container platform. As in version 2.4 there is still an option available to connect vCenter to NSX-T using Compute Manager. Here in this blog we will learn how we can unregister and register NSX-T extenstion from vCenter in case of any sync or vCenter connectivity issue with NSX-T. Lets get started.. 1) Login to NSX-T UI Go to -> System ->Compute Manager Here, vCenter is showing in Down status where the status is showing as "Not Registered" 2) When we click on "Not Registered" option its states below error. 3) When try to click on Resolve option its states below. At this stage if the Resolve option doesn't work then its require the remove the NSX-T extenstion from vCenter. To remove the NSX-T e